
Descriptions of elements in the Toggl environment
Clients
In the Toggl environment, our divisions are labeled as “Clients.” Clients are used to group projects. A client can have many projects, but each project is linked to only one client. This is useful for billing and reporting by client. These have been pre-configured for specific reporting needs. Please refrain from creating new clients or making any edits to these without first consulting the Graphics Supervisor.

Projects
In the Toggl environment, our brands are categorized as “Projects.” Projects are the main organizational structure within Toggl. Each project can be associated with one client, and you can track time against these projects. Projects can have tasks or sub-projects. These have been pre-established for specific reporting purposes. Please do not create new projects or modify these without first consulting the Graphics Supervisor.
Our objective is to track a complete 8.5-hour day for each user. Projects have already been set up for activities like Out of Office, Lunch, Meetings, and Training. Please ensure that all daily tasks are logged appropriately.
Tags
Tags provide additional context or categorization to time entries without affecting the project structure. Numerous tags have already been added to provide more detail to a task, particularly when a request involves multiple execution requirements. Please utilize these tags to convey the complexity of the task to others.
Tracking Time (Graphics Team):
Our aim is to allocate time generally, not to account for every second of your day. Feel free to round your time entries to the nearest 15-minute block. Please make sure your time entries are accurate and finalized by the end of each day, in preparation for any potential inquiries. Often, questions arise regarding how long someone has been working on a particular task or what an individual is currently working on. This documentation is crucial for demonstrating your activity or for management to reassess workloads.
- Start a Time Entry:
Click the “Start” button to begin tracking time for a specific task either in the mobile, desktop or web application. - Select Project and Task:
Select the appropriate client, project, and task that correspond to your work. Please avoid creating new Projects or Clients, as these have been pre-defined for specific reporting needs. - Add Description:
Provide a brief description of the task to give additional context, and use the pre-defined tags to describe the request. It is also beneficial to include the Jira project number in the description for cross-reference if necessary. - Stop and Pause Time Entries:
Click “Stop” when you finish a task or “Pause” if you need to temporarily halt tracking. - Editing Time Entries
Use the web to easily correct descriptions, tags and blocks of time
Reviewing and Reporting (Graphics Supervisor):
On the first business day of each month, the Graphics Supervisor is tasked with compiling a detailed list for ADV2 and generating a percentage report for accounting based on the data from the previous month. These both need to be sent to GL@advantus.com.
ADV2 – Detailed Project Report
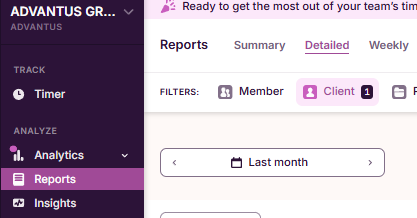
- Select Reports from the side menu.
- Choose Detailed at the top of the page.
- In the Client dropdown with checkboxes, check only ADV2.
- Include all Team Members.
- Set the Time Period to Last Month.
- Click Export at the top right of the screen, and from the dropdown menu, select Download CSV.

- Upload the CSV file to SharePoint in the Time Tracker folder
- Open the CSV file in Excel.
- Move Tags to Task: Transfer the entries from the Tags column into the Task column.
- Add Accounting Tags: For each entry, add accounting tags (FF, ISD, SJW) to the Task column
- Delete the Billing column.
- After editing, save the document in Excel format (.xls).
- Email or share the XLS file with GL
Divisions – Percentage Report
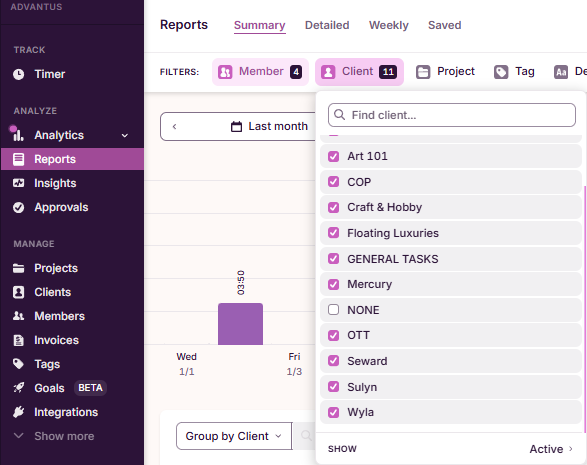
- Select Reports from the side menu.
- Choose Summary at the top of the page.
- In the Client dropdown with checkboxes, check all except NONE
- Include all Team Members.
- Set the Time Period to Last Month.
- This process will yield detailed percentage figures for each division. Use these numbers to complete the accounting format as required. Ensure the total adds up to 100% and email to GL.
| Divisional Allocations | |
| COP (includes BL) | 10 |
| Ottlite | 30 |
| C&H (includes, TH, SS, CH, etc.) | 0 |
| Art 101 | 5 |
| Sulyn | 0 |
| Wyla | 0 |
| ISD | 0 |
| ADV II (includes Empire, SJW) | 5 |
| Mercury Luggage | 15 |
| Seward Trunk | 0 |
| Floating Luxuries | 0 |
| Misc. unrelated to a division (e.g. training) | 35 |
| Total Divisional Allocation | 100 |